|
City of Boston’s Employee Earning’s Report 1. Who collects this data set? If it's an organization, which department of the organization? Is there a specific person listed who you could contact?
This data set was collected from the Boston Police Department. No specific person is listed. 2. Why do you think the organization collects this data? Does it specify how it uses the data? Although this data set doesn’t specify how the information is used, I have to assume that perhaps by keeping these records we can see if there is any corruption or anything like that going on. 3. What time period does the data set cover? Based on the data set we have, unfortunately there isn’t a column that shows the timeline. Since it’s an annual report, the time period that data set cover will probably be the whole year of 2017. 4. What are some of the questions you have about this data set? (Note: they can be basic like "why is this data being collected?" or very specific like "what does the field BUS_LIC_STATUS mean?"). Some of the columns in this data set are hard to identify what they represent. What do the terms “retro” or “detail” define in terms of earnings? There is a column that also identifies the cost of education incentives for this type of employment. I know that some companies offer educational stipends to employers so how does this data set represent that? Another thing I noticed is the significant disparities in regular earnings between a police sergeant detective and a police officer (not specific). One police officer makes nearly eight times the amount of regular earnings as a detective but a detectives total earnings are more than some police officers. I think in order to read the data you would have to have some background information about these jobs and what the different columns represent to get a better context. 5. Who are three types of people you could interview about this data set in order to learn more? The types of people we would need to interview about this data are the people who work the types of jobs that are included in this data set. If you are lucky enough to know them, the data set includes people with their names! This makes me wonder if the names are included because they willingly offered up their earnings information or if it was taken without their consent.
0 Comments
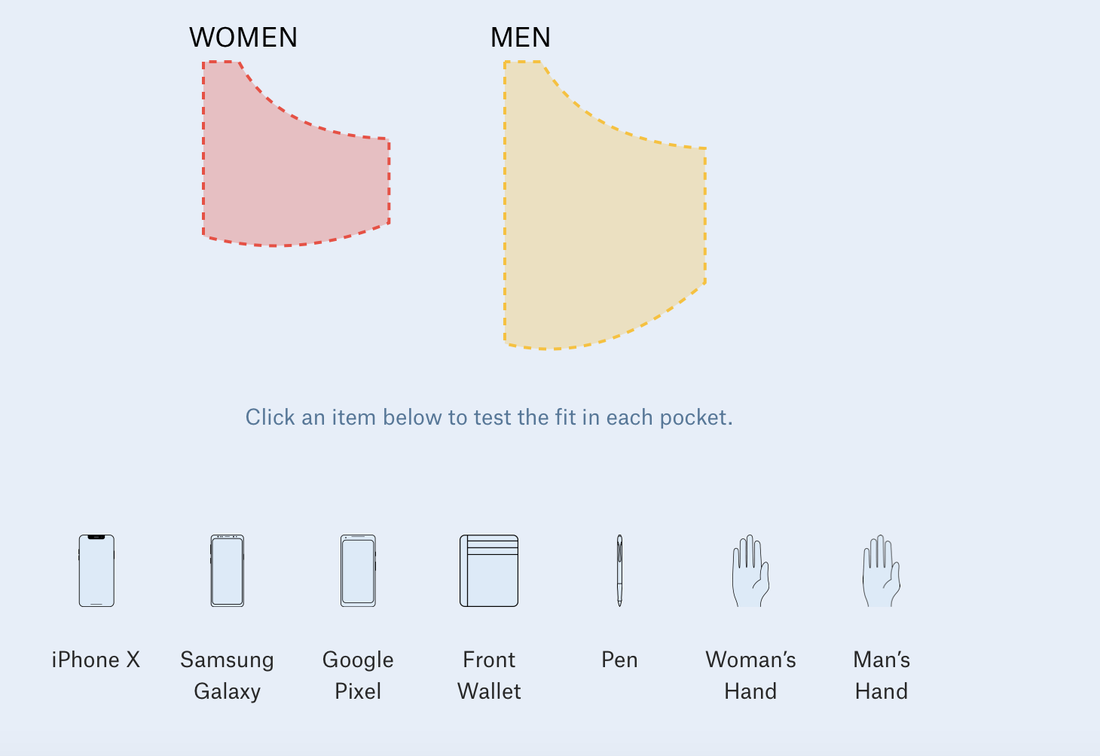 Women's pockets are inferior Women's pockets are inferior The data visualization blog I choose is the Pudding. In fact, I have been following the Pudding for months since the first time I was attracted by its contents in the form of visual essays. I am a fan of minimalism, so the way they present the stories and data, concisely and vividly, was very impressed to me. In this case, the complex data sets and explanations are easier for the audience to understand and remember. Apart from that, many topics they choose for the data analysis and visualization easily catch audience’s attention, such as why women’s pockets are inferior, The birthday Paradox Experiment. More importantly, one of the major differences that it has compared to other traditional data websites is that their data stories create an engaging and constant experience for the audience. In some stories, the findings are not a final publication, but are updated and vary by months or year based on algorithm. 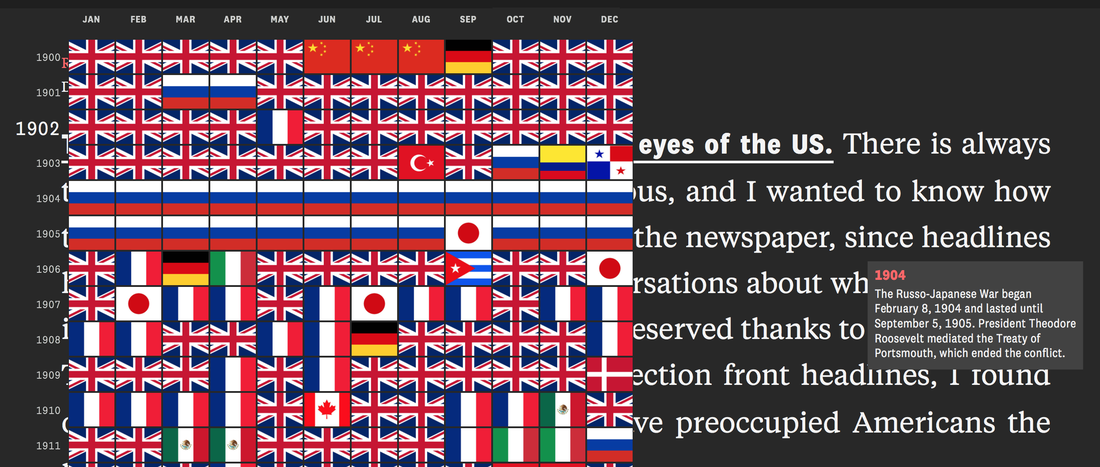 The world in the eye of US 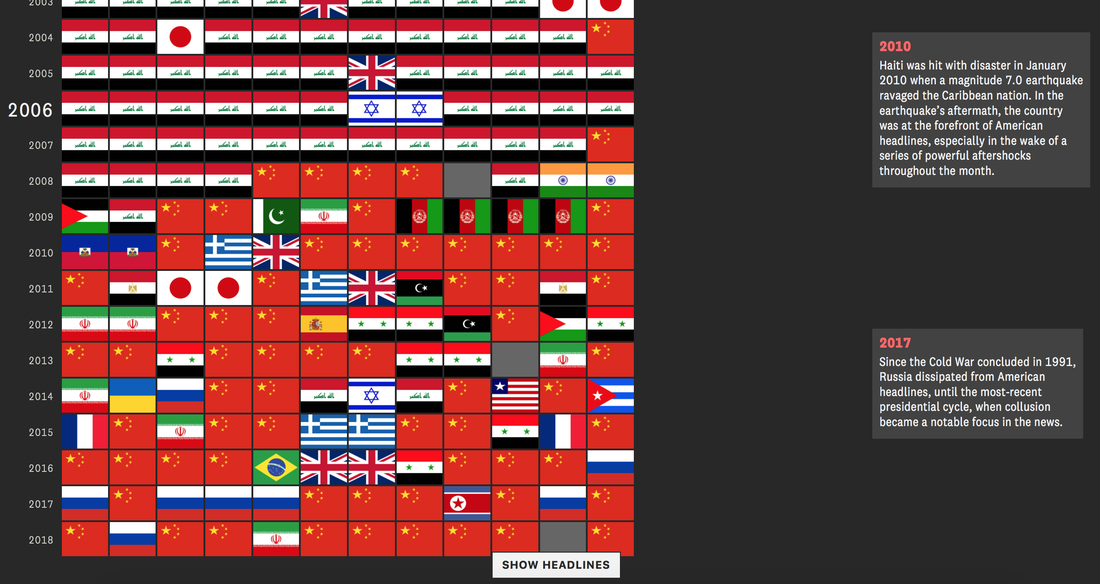 The world in the eye of US |
AuthorWrite something about yourself. No need to be fancy, just an overview. Archives
April 2020
Categories |
 RSS Feed
