|
On Jan. 20, 2020 WGBH reporter, Matt Murphy released an article with a gripping caption. “Gov. Charlie Baker No Longer Most Popular Governor In The Nation.” Charlie Baker had maintained a steady approval rating between 70-80% throughout his time in office. This earned him the recognition as America’s most favorite governor. Between the months of September to November Baker fell to 69% approval standing. This was right around the time Gov. Baker passed legislation banning all vape products in the state of Massachusetts. But the vape ban is lifted and we are now facing a different crisis: the COVID-19 pandemic. The Coronavirus pandemic has made the role of U.S. Governor’s all the more critical. Making decisions that range from closing down schools, businesses, public places have affected every individual in each state. Gov. Baker has received praise for his leadership efforts during the COVID-19 pandemic. His decision to shut down schools, non-essential business, and ban in person visits at nursing facilities has been well received by the public. A recent update on the report tweet sentiment visualization confirms that people who are tweeting about Gov. Baker expresses contentment with his leadership. Numbers show that the general attitude of people’s tweets about Gov. Baker is “happy” and “relaxed.” 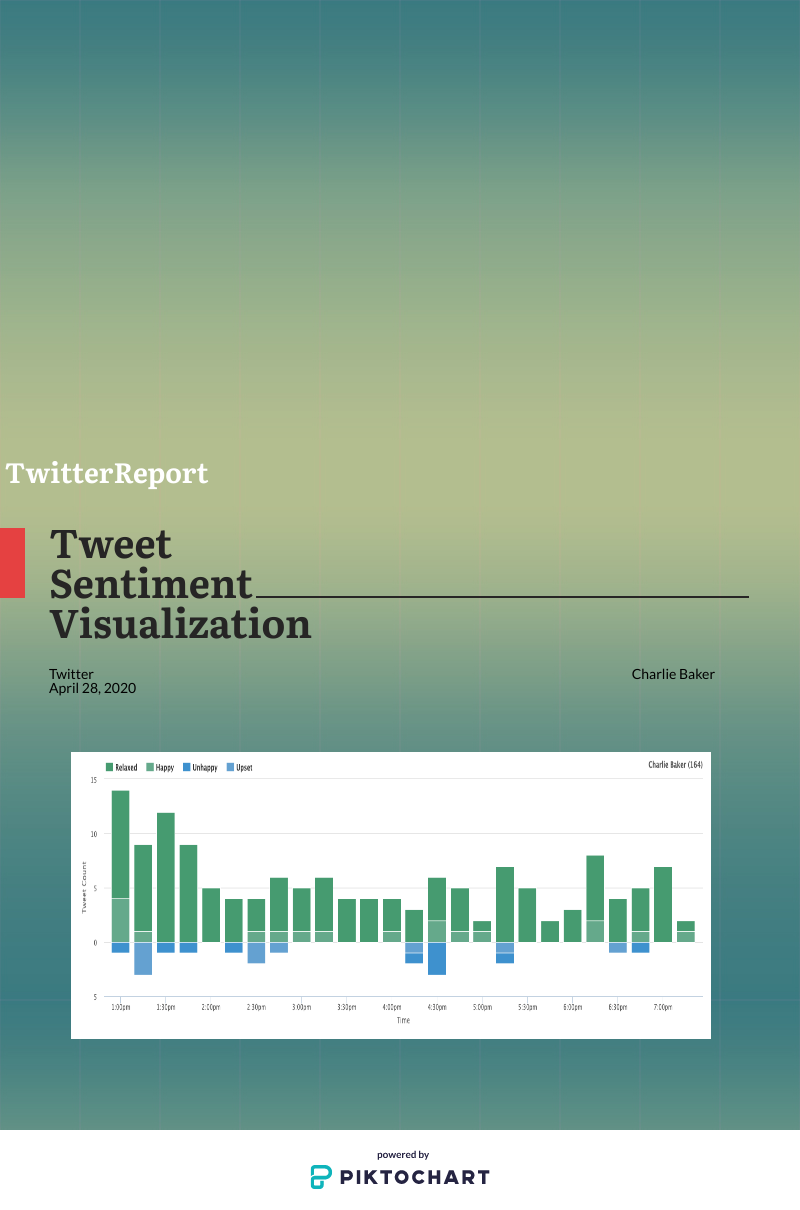 Mark Leccesse is a professor of journalism at Emerson College. Leccesse was assigned to cover Gov. Bill Weld in the 1980’s and he believes that overall Baker has been in good standing. “He’s had great polling numbers throughout his second term. His dip in approval only fell 19 percent. That is remarkable for any chief executive, and that poll still found him the third most popular governor in the U.S. As time goes by COVID-19 is still rearing its ugly head. According to an article released by Boston Globe the state saw the single highest death toll since the start of the pandemic. Gov. Charlie Baker gave a state house news conference and stated that the state is still on its plateau. Hospitals are seeing a steady rate of patients which is better than a sharp spike however on the same token cases are not falling at a consistent rate, Baker stated. At this rate Baker and the state still has a long uphill climb before we reach the other side. Giving him more time to spend on provisions and decision making to help flatten the curve of positive cases. Governor Baker also made a point to address the economic stress brought on by the pandemic. Baker has stressed the importance of workers, essential and those unemployed the benefits they need in order to sustain themselves. In an article released by Boston Globe it was reported that the state has paid out nearly half a billion dollars to meet the needs of gig workers and independent contractors that have been left without work. At the same time Baker is working with his constituents to observe phases of re-opening the state. Baker encourages civic-engagement between union/essential industry representatives and people working on his team observing to re-open the state. WGBH Journalist Callie Crossley recently published an article vehemently expressing her gratitude for Governor Baker’s leadership. Stating states like Florida, South Carolina, and Arkansas are potentially being faced with unprecedented circumstances due to Government officials opening up states too early. “Here in Massachusetts, Governor Baker took several initial steps to stop the spread of COVID-19 — shutting down all but essential businesses statewide, and the schools, and banning in-person visits at assisted living facilities. His own policy separating him from his 91-year-old father for the first time in 50 years,” said Crossley. It is important to acknowledge that individuals who are reporters and journalists have positive things to say about Baker. Abby Patkin, a reporter for BrooklineTAB feels that the spike in approval ratings for Baker may have to do with the policies that he rolled out to combat the spread of the virus. Patkin also suggested that Baker has made himself “quite visible and seemingly accessible via frequent televised briefings.” According to an article published by WHDH Massachusetts has been ranked one of the most aggressive states combating coronavirus. The article states that this is largely due to the fact that new policies have been implemented frequently and the most tested for coronavirus per capita. This information can be seen as a surge in productivity in the Governor’s office and other officials who have been appointed to combat the virus. An article published by fivethirtyeight shows how most Americans are pleased with the way their governors are handling and have handled the coronavirus pandemic. Governor of Ohio Mark Dewine has received immense praise for getting ahead on policies/provisions reportedly at a time when Donald Trump was undermining how big of a problem this was going to become. Many governors including Baker have seen more favorability in comparison to Donald Trump according to many reports. Methods and Data We wanted to begin our data search with a general understanding of Governor Baker’s most recent ratings alongside other governors across the country. The initial article from WGBH was our starting point and contained a link to a data set provided by Morning Consult - a political-driven website that presents various amounts of data, articles and reports. We found one page that ranked the United States’ top ten governors and provided specific information about their approval ratings over time and among both political parties (Republican and Democrat). In addition, this page had a very simple data set ranking governors by their margin of error: a numerical system that measures the performance of politicians. This data was collected via surveys that Morning Consult conducted with registered U.S. voters from October 1, 2019 through December 31, 2019. The data was used to determine the Q4 2019 Governor Rankings. You can find the original data set here but below is a visualization representing Governor Baker alongside the nation’s governors’ who received the highest (a.k.a. the worst) rating. We devised this visual to show how Baker’s approval directly correlates with other governors across the nation and ensure that even though he lost his place as “America’s favorite governor,” he still holds a higher rank than most. 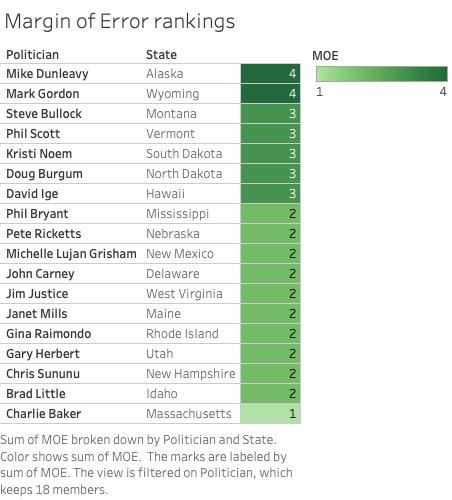 After looking over this article, we started to search for more specific data on Governor Baker’s approval ratings. This first brought us to discover a Google trends site that tracked the amount of Google searches associated with Governor Baker’s name as well as any other related categories. These categories included topics such as coronavirus (which was a topic we originally planned to explore in comparison to Baker’s performance), Massachusetts, press release and more. Initially, we wanted to construct a timeline showing how Baker’s approval ratings have changed since COVID-19 broke out in Massachusetts. However, being that this site showed search trends instead of approval data, we constructed a different timeline that traced how often Charlie Baker’s name was put into Google. We did one timeline with just the governor’s name and one with his name and “coronavirus” attached to it. This is what we found: 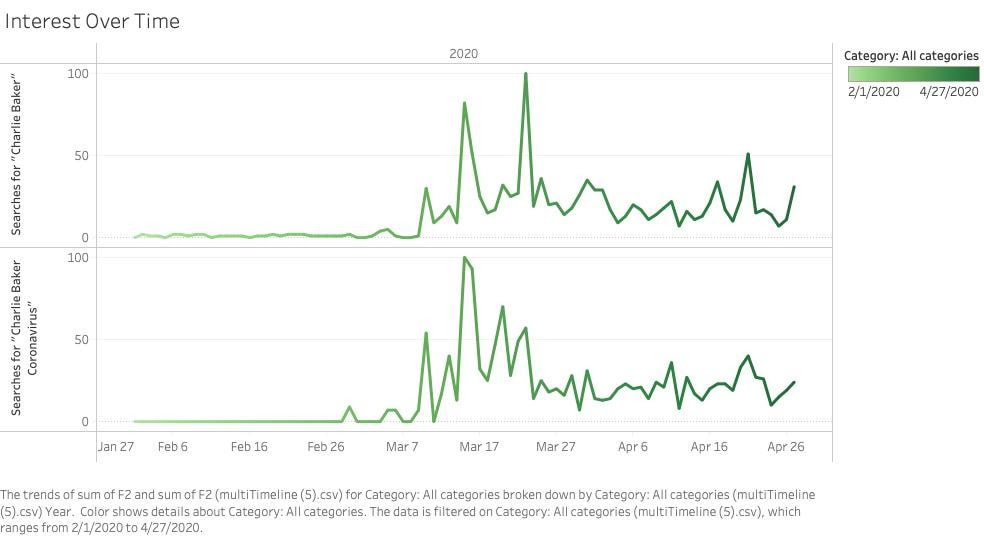 The graphs indicate that there had been a sudden rise in search results for both Charlie Baker and his response to the Coronavirus pandemic. Both search histories remained relatively the same and exhibited multiple spikes around mid-March. This was the timeframe that COVID-19 was beginning to gain traction in the United States. Therefore, we can assume that people were generally interested in the governor’s reaction to the crisis and his overall popularity was sustained. After not having a ton of luck finding Baker’s most recent approval ratings, we turned to older data sources. We still wanted to paint a picture of the governor’s overall popularity over the past couple of years. This led us to find polling information from Wikipedia in regards to Baker’s overall approval ratings and favorability from specific polling groups in Massachusetts. This data led us to understand that Baker has always had favorable reviews. We created a dashboard with two charts showing the overall average of these ratings from the various polling groups. While these are not the most recent ratings, they still hold a great deal of insight into Baker’s performance over the past five years. 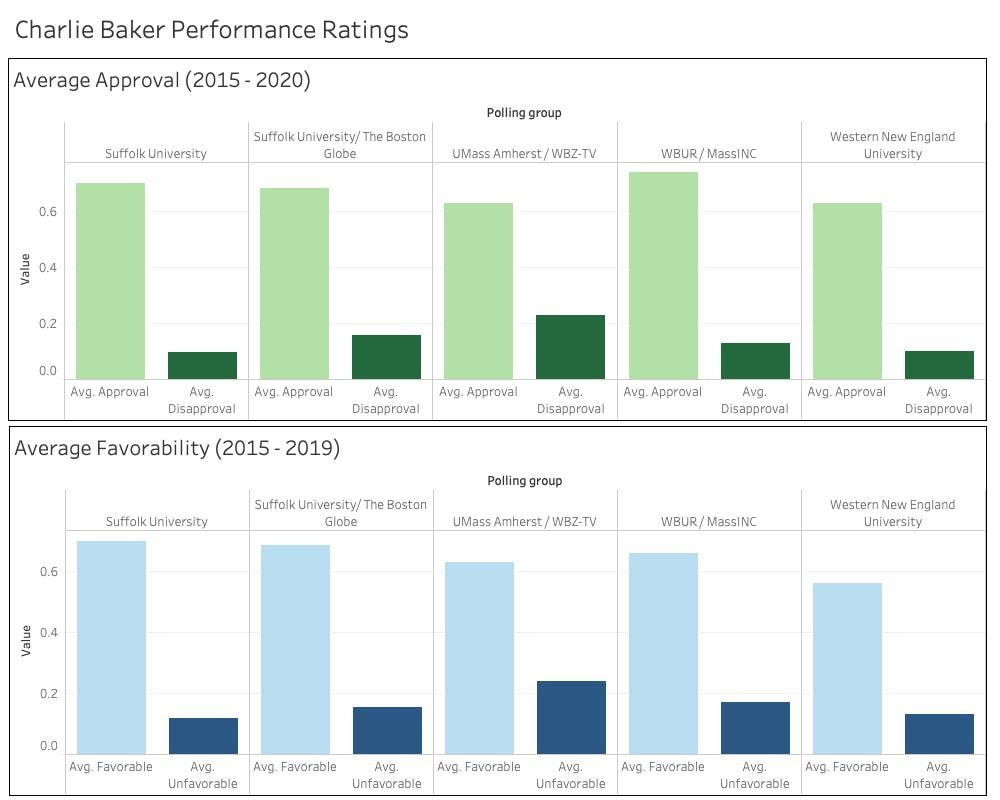 Lastly, we took our data story back to the national level and compared, not only Governor Baker’s performance, but the performance of all U.S. governors to that of President Trump. We found an article from fivethirtyeight.com with tables that compared national averages between both entities. In addition, the article also listed how some U.S. governors’ ratings were impacted by COVID-19. This was another component we looked for in our story because we wanted to observe where Baker landed among the national averages as well as against the President; whose ratings have also fluctuated during the pandemic. 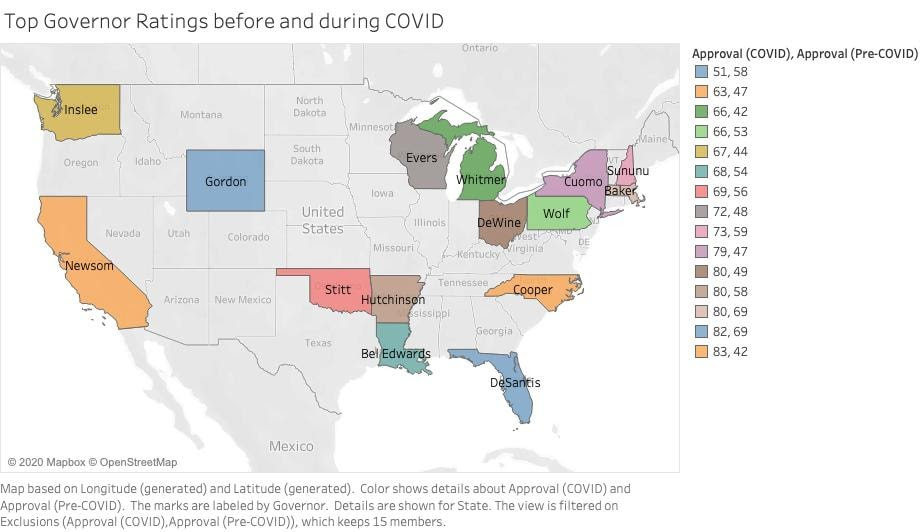 The article describes how most Americans were satisfied with how their governors were handling the pandemic. This visual depicts the highest-ranking governors with their ratings from before and during COVID. Baker was included on the list. In addition, this chart shows how most Americans are favoring their governors’ response to the crisis over the president. 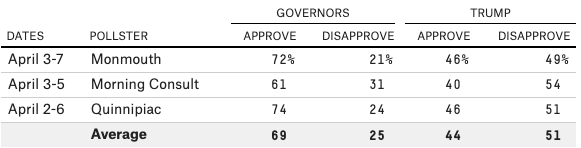 (taken directly from fivethirtyeight.com) According to data we found from 2015 to 2020, we can see that Charlie Baker’s average approval rating and favourability have been slightly increased in 2020. With the interviews we had, we believe that what Baker did during the pandemic supported his approval rating.The five polling groups, especially WBUR/MassINC and Western New England University, showed favorability on him at different levels, which also supported our hypothesis. Generally, the margin of error (MOE) refers to the amount of random sampling error in the results of a survey. The larger the margin of error, the less likely the poll result reflects the entire population. Since Charlie Baker has the lowest MOE, which is 1, we believe the data reflects the choices of the polling group, his average approval ratings and favorability in Massachusetts.
In conclusion, the coronavirus has been changing people’s opinions and approval ratings on different Governors in the United States. However, Charlie Baker, among them, earned himself a high approval rating even during the pandemic. Despite the fact that his favorability declined a bit by the end of 2019, his approaches, policies and actions at this time has supported his long-term favourability status.
0 Comments
Coronavirus Cases in Massachusetts The Massachusetts Department of Public Health for the first time released the number of COVID-19 cases by each city and town in the state. Originally we planned on presenting a visualization of these cases by county, since that was the only form in which this data was presented, but now we can specify it to tell a different story. In terms of cleaning this data set, we would generate a calculated field to round out every decimal value for the rate of cases in each town. 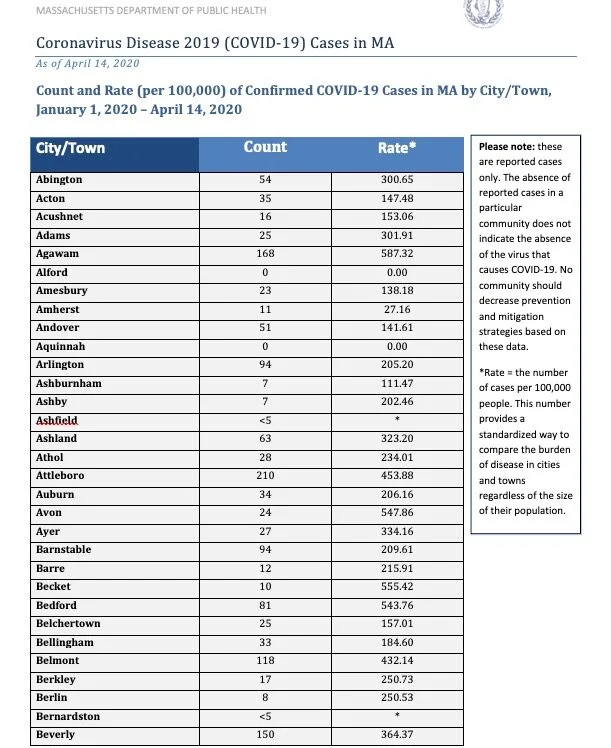 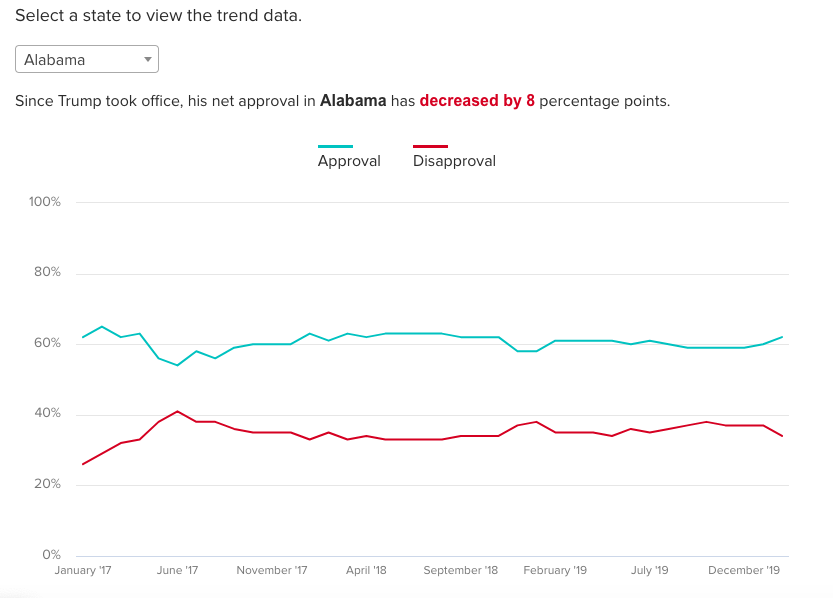 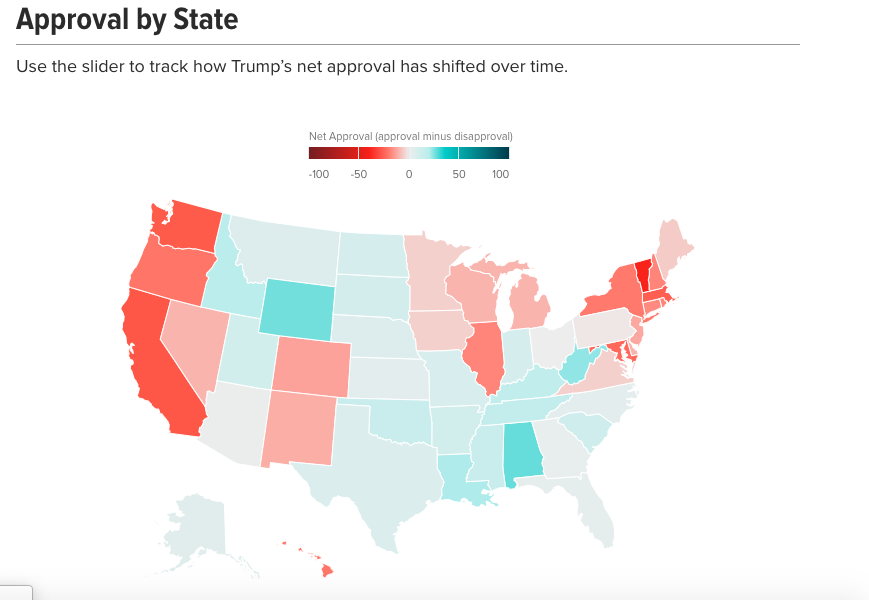 GOV-Q4-2019 This chart is a list of U.S Governors and their corresponding states. The column that reads MOE stands for margin of error. Margin of Error is a statistic calculating a random sampling error in the results of a survey. The higher the number the less likely the result of the survey reflects the entire population of that state as a whole. A substantial amount of people have been discounted from the survey. 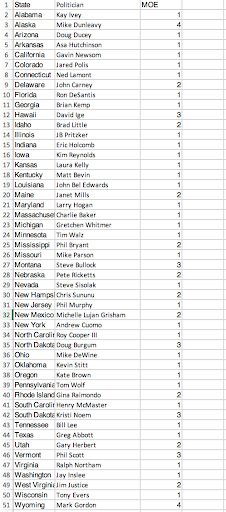 Public Schools in Boston, 2018 - 2019 Below is part of the chart of public schools in Boston during the year between 2018 and 2019. The data contains key factors such as school names, locations and types. In this case, we could categorize the datasets by their type or location.We want to know how people working in public schools have been affected by the coronavirus and their opinions on Baker’s actions during the pandemic. By using and analyzing the data, we want to see if it reflects the hypothesis or the trend as shown above. 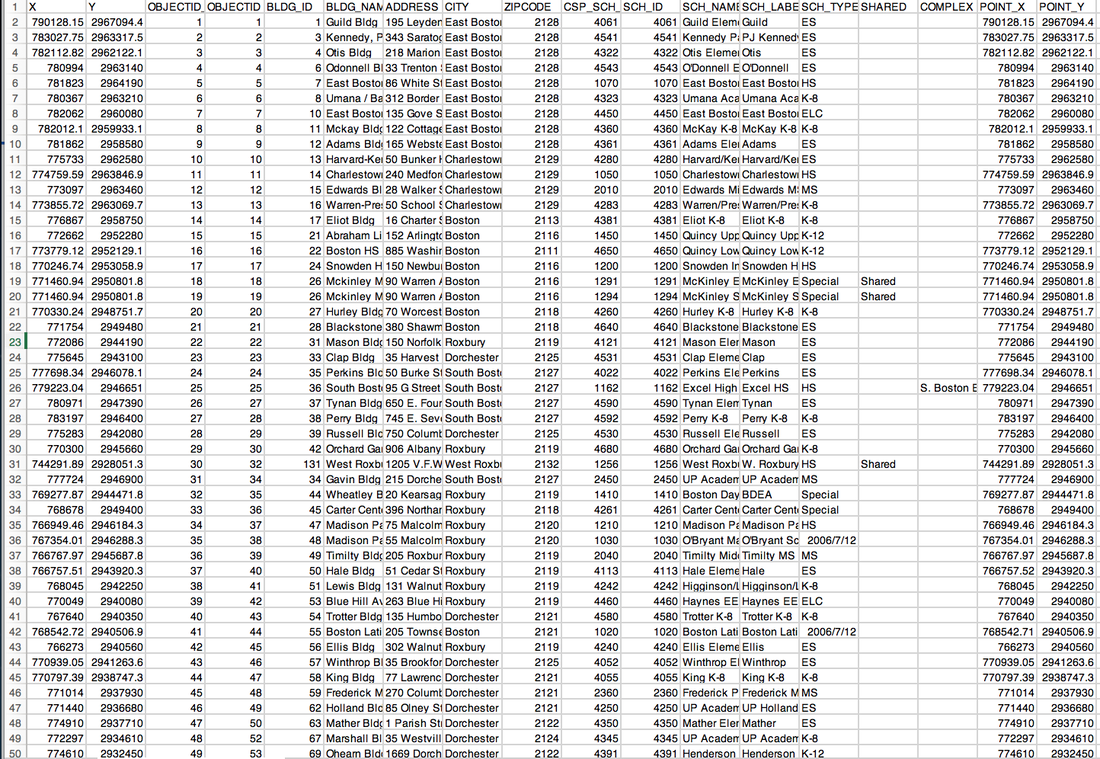 Interview Sources
After combing through the internet for more data sets, we came out slightly empty handed. There was not too much data specifically on Governor Baker or his ratings. Therefore, we are looking to turn to personal opinions and anecdotes for more information on the situation. Our next step in our process is to start conducting interviews to help round out our understanding of the situation and test our hypothesis of whether or not Baker’s response to the pandemic has in fact caused his approval ratings to drop. If you were an international student seeking for colleges or work opportunities in the United States, what would be your possible choice? As two major cities in the western and eastern coast of the US, Seattle and Boston both have unique educational resources, fast-growing economies, and technologies. So, what does the recent research data says about the two cities?
According to Data USA, in 2018, Seattle and Boston have a similar population. Seattle has a population of 744,949, and the population in Boston is 695,926. The two cities also have a similar median age of 35.2 and 32.1, respectively. However, there are some major differences between the two in terms of income and employment. The number of employees in Seattle is 451,954 with a 3.77% growth rate, while Boston has 382,784 employees with a 0.31% growth rate. The median household income of Seattle ($93,481) is higher than that in Boston ($71,834), despite the fact they both have a growth rate of 7.6%. However, the growth rate of annual median property value in Seattle is twice as much as that in Boston. Another interesting finding is that in Seattle, there were 4.07 times more White Alone residents in 2018 than any other race or ethnicity, while the rate in Boston was 1.99 times. The data shows the diversity of race is distributed more evenly in Boston. For residents who live in Seattle, the most common industry is Professional, Scientific and Technical Services. The highest paid jobs are related to legal Occupations, Computer & Mathematical Occupations, and Computer, Engineering & Science. In comparison, the most common industry in Boston is Health Care & Social Assistance. The highest paid jobs are related to Law Enforcement, legal Occupations, and Management. |
AuthorWrite something about yourself. No need to be fancy, just an overview. ArchivesCategories |
 RSS Feed
